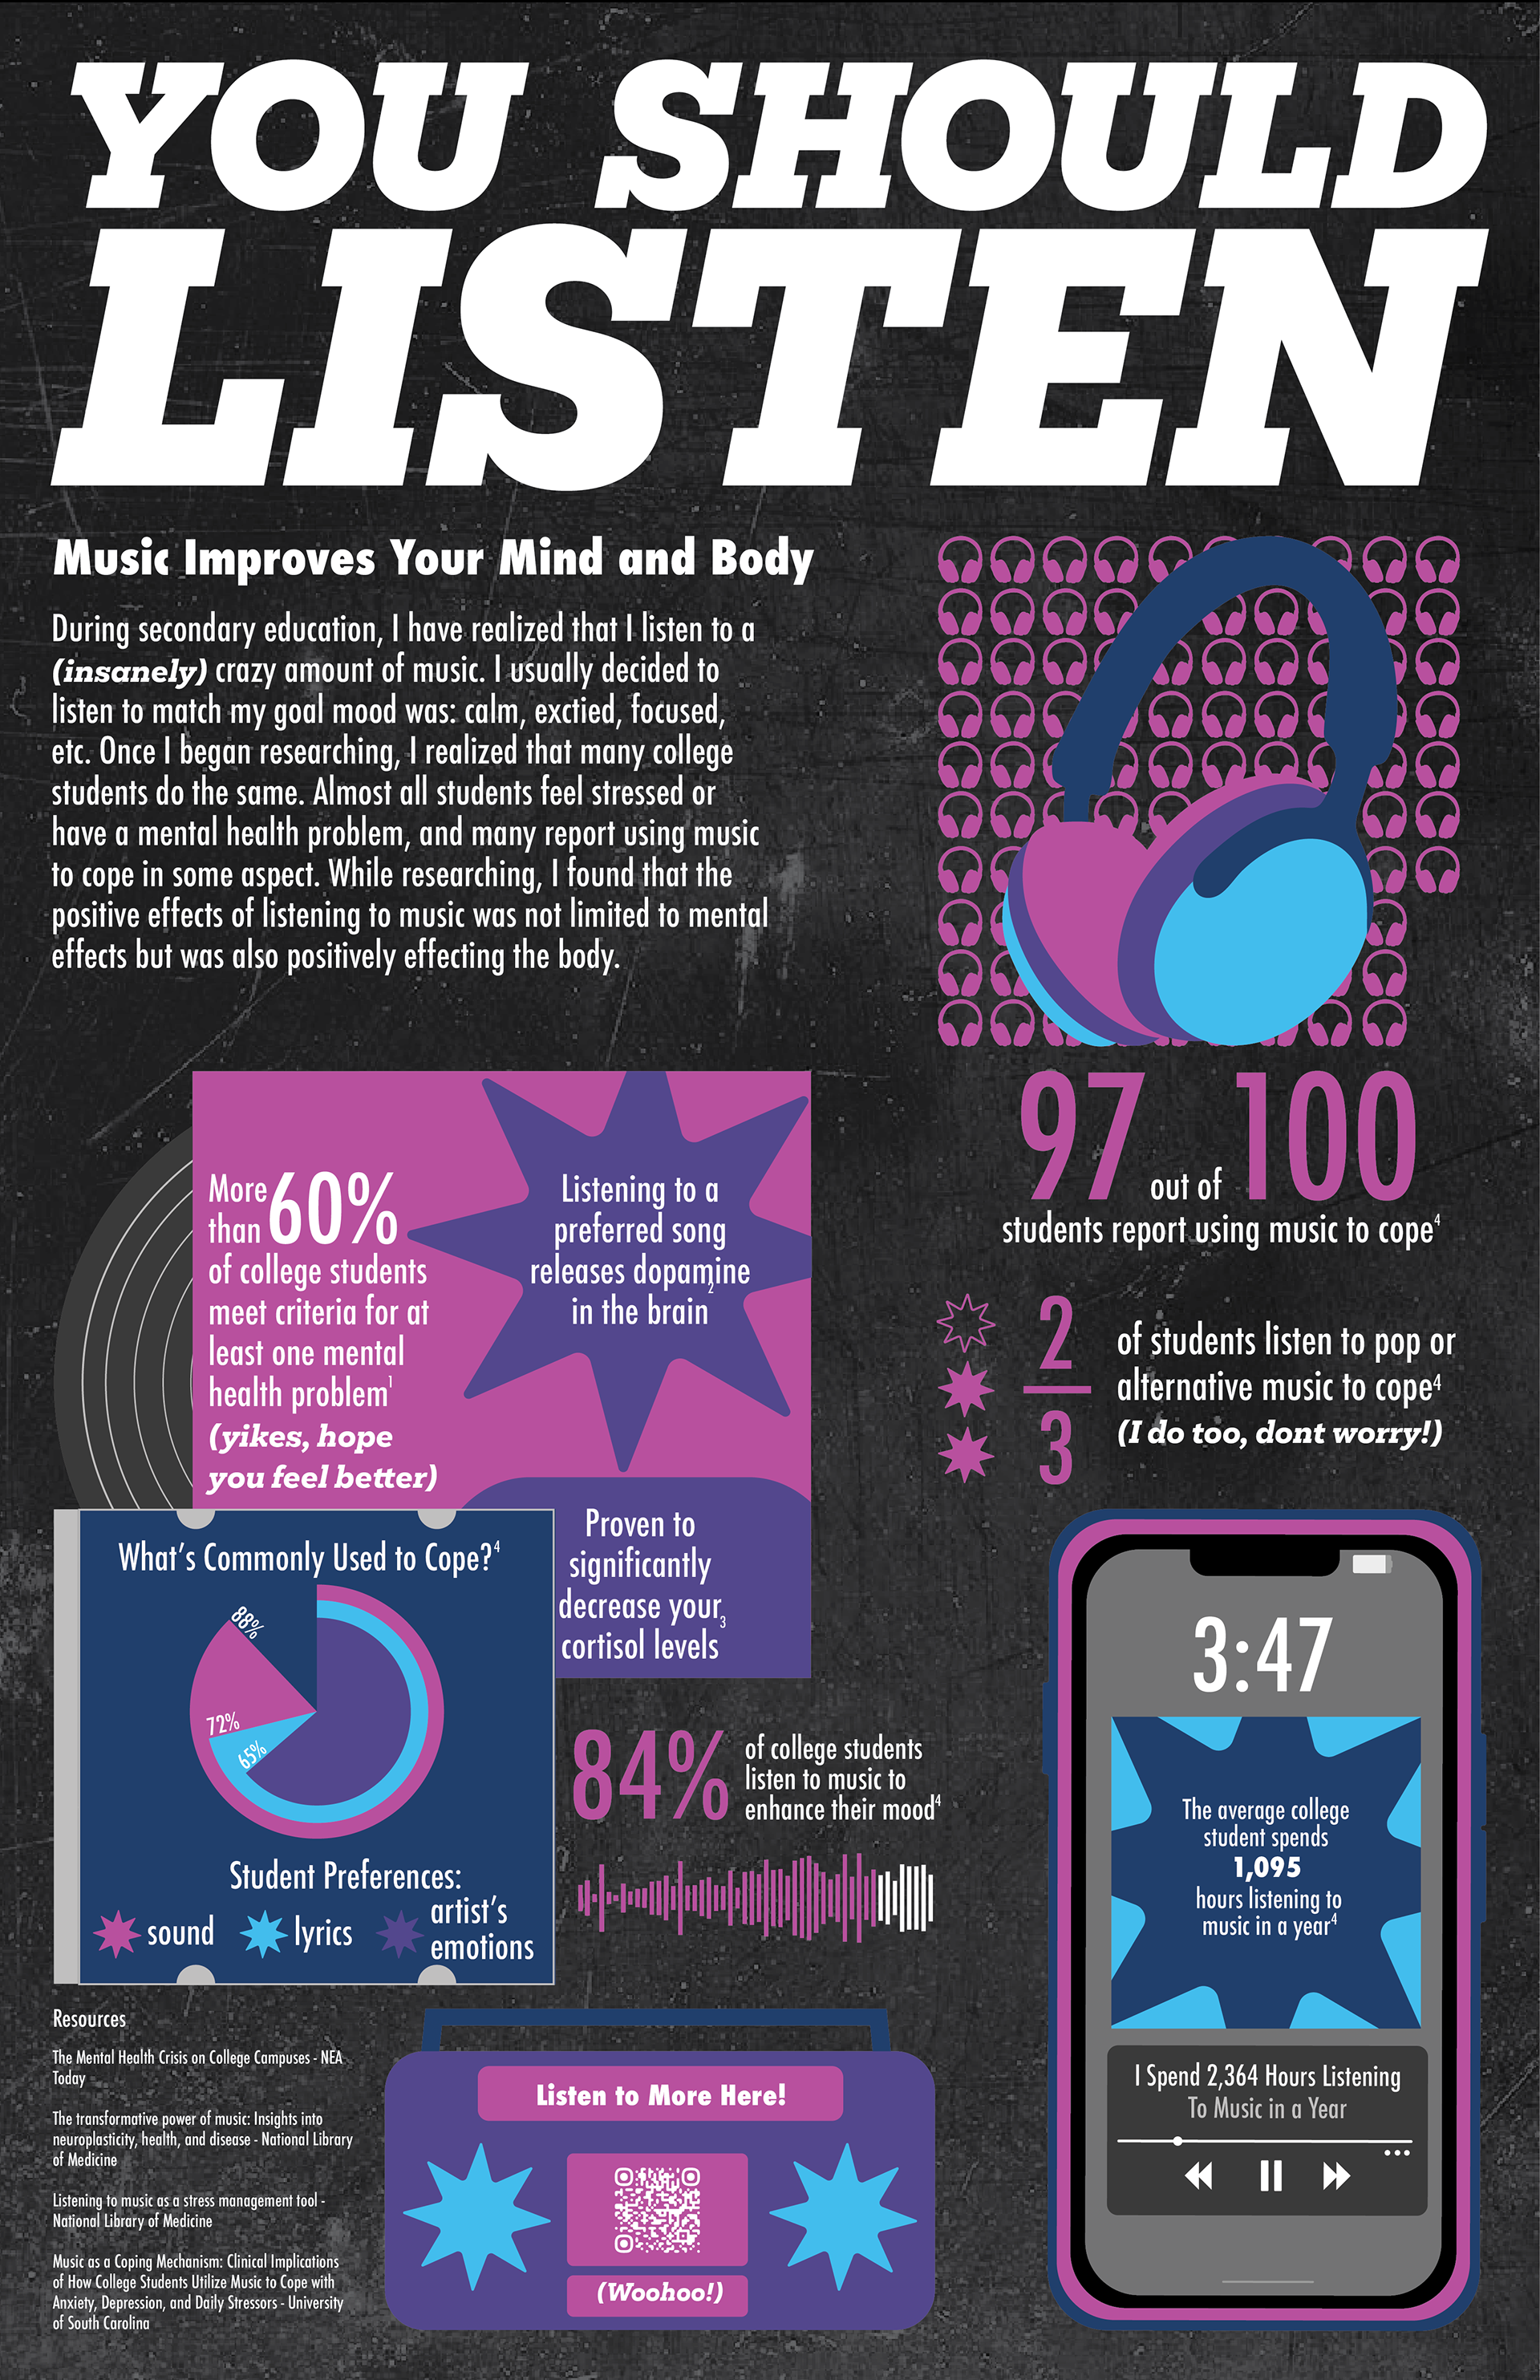
One of the first projects of my senior year was to track my habits and speculate about them on a global scale. I decided to focus on an overall positive habit, listening to music, to spread positivity. After researching for two weeks, I gathered my data set based on college students and began creating a visual language. I went through one complete restart and landed on the final iteration shown below. I included six different data visualizations, and I also added my personal data. The final step of the project was to create an animation that paired with the poster and further explored how the data visualizations moved.